
Borehole Data Platform
Automatic and Consistent Televiewer Analysis
Cloud-based structure picking, classification, and rock mass strength metrics for televiewer data. Upload borehole data and review results in minutes, right in your browser.

Borehole Data Platform
Contact for beta
What is the Borehole Data Platform
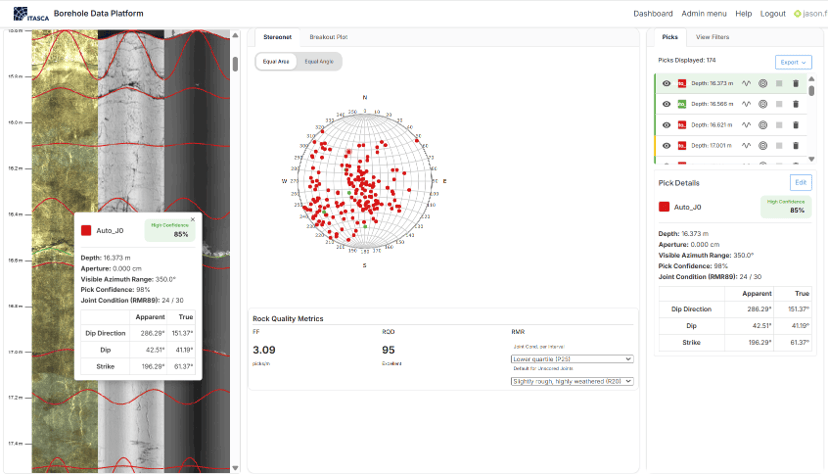
The Borehole Data Platform is a browser-based SaaS platform for geologists, geotechnical engineers, and mining teams who interpret borehole televiewer images. Upload your WellCAD files and the app automatically picks structures, classifies them, and calculates rock mass strength metrics. You get fast, consistent, auditable interpretations from anywhere, with no software to install.
Manual picking is slow, costly, and varies from one interpreter to the next. The Borehole Data Platform augments your team’s expertise with machine learning built by ITASCA’s geomechanics specialists. Your experts spend their time reviewing and refining, not picking line by line.
How the Borehole Data Platform Works
ITASCA’s Borehole Data Platform is a fully hosted SaaS service. All computation and data storage run in the cloud, so you need only a web browser. A typical borehole is processed in about five minutes. Our Cloud microservice architecture allows any number of boreholes to be processed in parallel: five minutes for one hole, five minutes for fifty holes.
- Upload borehole data. Create a project for a mine site or drilling campaign, then drag and drop your WellCAD (.WCL) files. Televiewer extracts the acoustic amplitude, travel time (caliper), survey azimuth and tilt, and any existing structural picks.
- Run automated feature detection. ITASCA’s image enhancement and picking algorithms find the planar features crossing the borehole wall and converts them to depth, dip, and dip direction. Shallow, low-angle joints are captured too.
- Classify structures. A machine learning model trained by ITASCA experts on tens of thousands of labeled structures classifies each pick as an open or closed joint. Every structure gets a confidence score and a measured aperture.
- Review and refine. Inspect results in the interactive borehole viewer. Filter by depth, aperture, type, or confidence, and adjust or add structures where your judgment differs.
- Generate structural summaries. Televiewer calculates RQD, fracture frequency, and RMR over 3 m intervals from your filtered structure set.
- Export results. Download structures and rock mass metrics in a standardized format for your geotechnical, structural, and resource models.
What You Can Achieve With the Borehole Data Platform
Image Ingestion & Management — Organize WellCAD files by project, site, or campaign. Upload any number of boreholes with drag and drop, and keep every interpretation in one secure, shared place.
Automated Feature Detection — Pick bedding, joints, and other planar structures automatically, including low-angle features that are easy to miss. Reprocess poorly picked historical data at a fraction of the cost of manual re-picking.
Interactive Geologic Interpretation — Scroll the borehole image, stereonet, breakout plot, and structure list side by side. Click a stereonet point to jump straight to that structure in the image.
Structural & Geomechanical Outputs — Get depth, dip, dip direction, aperture, and open or closed joint class for every structure. Calculate RQD, fracture frequency, and RMR over 3 m intervals.
Integration & Export — Export standardized structure tables and rock mass metrics ready for slope design, resource modeling, and groundwater studies.
Quality Control & Audit Trail — Every pick carries a classification confidence score, and filtered structures are excluded from exports and metrics. Results are consistent and repeatable, even when data comes from different service providers.
Why Choose the Borehole Data Platform
Televiewer use is becoming more common in the mining industry, and this data needs to be treated consistently. Manual televiewer interpretation can slow projects and introduce bias into the interpretation, and data from different time periods may have been interpreted by different consultants for different purposes (exploration, resource, geotechnical). With the Borehole Data Platform, you can quickly and confidently reprocess your existing televiewer data.

Accelerated Interpretation
Automated picks and classification in about five minutes per borehole, with tools to refine them.

Consistent Geologic Logging
Standardized, repeatable, unbiased outputs across holes, sites, and contractors.

Cloud Collaboration
Shared projects and multi-user access in the browser, with nothing to install.

Improved Data Quality
Image enhancement, confidence scores, and filters help you deliver fit-for-purpose results.
Borehole Data Platform Applications

Build structural domains and joint sets from consistent, defensible borehole data.
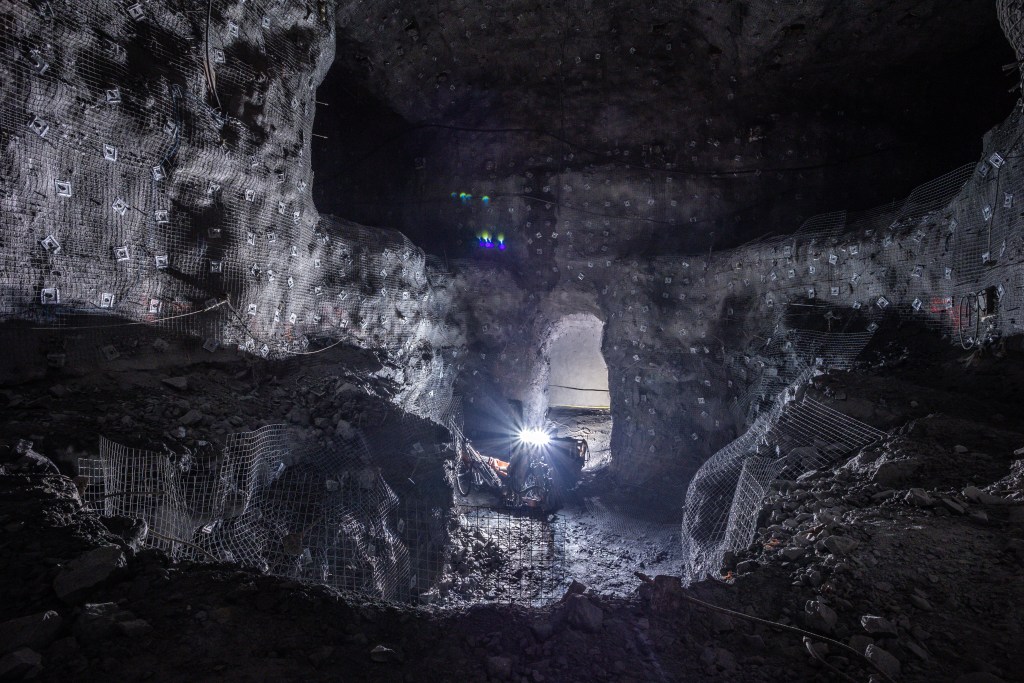
Characterize frequency and rock mass quality ahead of development.

Cross-check core logs and contractor picks, and reprocess legacy televiewer data.

Locate open structures and apertures that may control fluid flow.
Built for Geotechnical Practitioners
The Borehole Data Platform is built for engineers and geologists who need reliable structural data without spending days picking images by hand.
Who it’s for
- Geotechnical and rock mechanics engineers
- Structural and exploration geologists
- Mine planning and operations teams
- Hydrogeologists
- Consultants and drilling service providers delivering televiewer interpretations
Typical workflow
To get started, you only need a browser and your existing WellCAD files.
- Create a project for your site or drilling campaign.
- Upload WellCAD (.WCL) files. Processing starts automatically.
- Review results in the borehole viewer, about five minutes per hole.
- Filter and refine structures, enter joint condition and intact rock strength scores for RMR, or use the intact rock and joint condition machine learning predictions.
- Export structures, RQD, fracture frequency, and RMR into your stability analysis, structural model, or database.
Supported data & formats: Acoustic and optical televiewer (OTV/ATV) data in WellCAD .WCL files.
Integrations: Standardized exports for geotechnical databases and modeling tools. Direct FLAC and 3DEC workflows are coming soon.
Performance & scalability: About five minutes per typical borehole, with hundreds of structures classified in seconds. Upload any number of boreholes to a project.
Security and Compliance: With industry standard security and encryption, you can be confident your data is safe.
Because the Borehole Data Platform is a SaaS service, ITASCA manages the hosting, updates, and model improvements. You always work on the latest version.
What Makes the Borehole Data Platform Different
The Borehole Data Platform pairs automated picking with machine learning classification, so you start from a near-complete interpretation instead of a blank image.
| Aspect | Borehole Data Platform | Manual Picking | Desktop Autopick Tools |
|---|---|---|---|
| Deployment | Browser-based SaaS | Desktop software | Desktop install |
| Structure picking | Automated, including low-angle features | By hand | Automated; often needs re-picking |
| Open vs closed classification | ML model with confidence score | Interpreter judgement | Manual |
| Aperture measurement | Automatic | Manual | Varies |
| Rock mass metrics (RQD, FF, RMR) | Built in, per 3 m interval | Separate calculation | Separate calculation |
| Consistency across holes and contractors | Standardized and repeatable | Varies by interpreter | Varies by settings and user |
| Time per borehole | About 5 minutes, plus review | Hours to days | Varies |
Common Questions from Teams like Yours
Answer: The platform currently processes acoustic televiewer data in WellCAD (.WCL) files, including amplitude, travel time, survey azimuth and tilt, and any existing picks.
Answer: No. The Borehole Data Platform is a SaaS platform that runs in your web browser. All processing and storage happen in the cloud.
Answer: About five minutes for a typical borehole, from upload to results in the viewer.
Answer: The classifier identifies open vs closed joints with 85% accuracy on validation data from two mines. Each structure also has a confidence score, so you can filter and review the less certain picks
Answer: Yes. You can adjust or add structures and filter by depth, aperture, type, or confidence. Filtered structures are excluded from exports and rock mass metrics.
Answer: Structure depth, dip, dip direction, aperture, type, and confidence, plus RQD, fracture frequency, and RMR over 3 m intervals. You also get a stereonet and breakout plot.
Answer: Yes. The Borehole Data Platform is a cost-effective way to re-interpret legacy or inconsistently picked data to one standard.
Answer: Yes. We follow current industry-standard security practices. After a secure login process, your data is transmitted to the cloud using TSL encryption, and stored data is encrypted.
Ready for the Next Steps?
If you’re exploring the best solution to handle your borehole data, talk with our team to try a demo firsthand and learn about pricing.